3. PerformancePoint Services
The web parts that are available out of the box are
great for adding basic BI functionality to portal sites or other
SharePoint applications. However, when it comes to building a dedicated
BPM portal, the real jewel in the SharePoint 2010 crown is
PerformancePoint Services, with features that allow developers and BI
professionals to create highly interactive BPM portals.
Ultimately, PerformancePoint solutions are delivered
as a series of SharePoint web part pages and can therefore be completely
integrated into a larger portal solution in the same way as any other
SharePoint content. Although the pages consist of a collection of
PerformancePoint-specific web parts, a rich client editing experience is
provided via the Dashboard Designer, which is accessed as a
ClickOnce-deployed application from any PerformancePoint-enabled site.
3.1 Using PerformancePoint Within a Site
To use PerformancePoint within a site, you must
create a few specific lists and libraries. In much the same way as the
Status Indicator web parts, PerformancePoint content is based on a few
custom content types. Data based on these content types is then stored
in specific lists and libraries, which are referenced in turn by the
custom web parts. To add PerformancePoint functionality to an existing
site, take the following steps:
Enable
the PerformancePoint Services Site Collection Features at the Site
Collection level. From Site Settings, choose Go To Top Level Site
Settings | Site Collection Features.
Enable the PerformancePoint Services Site Features feature in Site Settings | Manage Site Features.
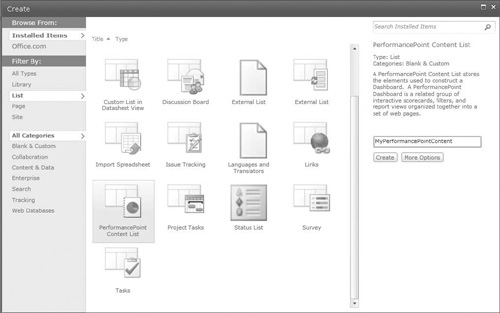
Add a new list based on the PerformancePoint Content List type, as shown:
Add a new data connections library based on the DataConnections Library for PerformancePoint type.
Note
The PerformancePoint data connection library uses a
different template to the standard data connection library that is
generally used by Office applications. Be sure to select the correct
type when creating the library. The difference between the two is that
the standard data connection library can contain only Office Data
Connection files as used by Excel or Universal Data Connection files as
used by InfoPath, whereas the PerformancePoint library can also include
the PerformancePoint Data Source content type. Bearing this in mind, you
can convert an existing data connection library to support
PerformancePoint simply by adding the PerformancePoint Data Source
content type.
Add a new library based on the Dashboards library type.
3.2 Dashboard Designer
To start using the PerformancePoint Dashboard
Designer, navigate to the PerformancePoint content list and then add a
new item. The Dashboard Designer will start automatically, as shown
here:
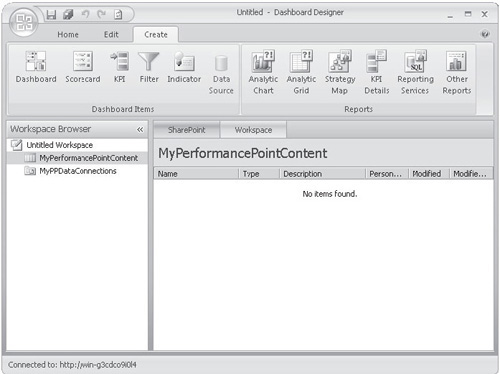
The
Workspace Browser performs a similar function to the Solution Explorer
in Visual Studio: it allows you to see all the items that are available
for use within the project. One important difference here, however, is
that two views are available for each of the items listed in the
Workspace Browser: the SharePoint view, which lists all the items in the
associated SharePoint list, and the Workspace view, which lists all the
items in use in the current workspace. An item from SharePoint can be
added to the current workspace by double-clicking it.
One thing to bear in mind about the Dashboard
Designer is that workspace files can be saved to the file system. You
can open these files using the Open command in the Dashboard Designer or
by double-clicking the filename to view the workspace, which will be
automatically bound to the appropriate SharePoint lists. However, it’s
also possible to use the file to export a workspace to another site.
Rather than opening the file directly, you can click the Import Items
button in the Home menu of the Dashboard Designer application to allow
artifacts from the workspace file to be imported and automatically added
to a new SharePoint site.
3.3 PerformancePoint Data Connections
In much the same way as Office Data Connections
(ODCs) are created and managed via the Excel client application and
Universal Data Connection (UDCX) connections are managed via InfoPath,
PerformancePoint connections are created and managed using the Dashboard
Designer application.
A
number of different types of data sources can be used, including
Analysis Services, Excel Services, SharePoint lists, and SQL Server
tables. To provide the highest degree of interactivity, an Analysis
Services–based data source is the preferred option. However, as you’ll
see later, PowerPivot offers a new way for knowledge workers to create
in-memory Analysis Services cubes easily using an add-in for Excel
client. When PowerPivot integration is configured, SharePoint makes use
of Analysis Services in SQL Server 2008 R2 to host these user-generated
cubes; as a result, they are usable by PerformancePoint in the same way
as cubes generated using the more traditional data warehousing method.
To demonstrate how to use the Dashboard Designer, consider the AdventureWorks sample database available from www.codeplex.com/MSFTDBProdSamples.
In addition to the sample databases, we’ll also need to deploy the OLAP
sample project that can be found at C:\Program Files\Microsoft SQL
Server\100\Tools\Samples\AdventureWorks 2008 Analysis Services
Project\standard after the AdventureWorks sample project has been
installed. For full details of how to set up the sample databases,
please see the instructions that are available from the CodePlex site.
To create a connection to an OLAP data source, take the following steps:
In
Dashboard Designer, select the Data Connections folder that we created
earlier when we enabled PerformancePoint functionality for our site.
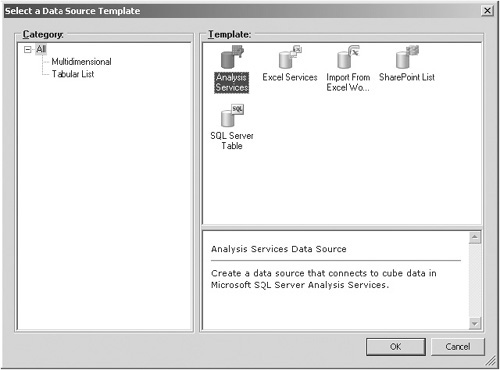
Select the Create tab on the ribbon, and then click the Data Sources button in the Dashboard Items section.
From the Select a Data Source Template dialog, click Analysis Services, as shown, and then click OK:
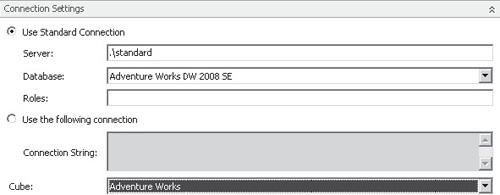
In the Properties tab, set the name of the new connection to AdventureWorksOLAP.
Then in the Editor tab’s Connection Settings section, enter the name of
the Analysis Services instance that hosts the AdventureWorks OLAP
sample cube. Select the Adventure Works DW 2008 SE database and the
Adventure Works Cube.
The three options in the Data Source Settings section warrant some explanation:
Unattended Service Account
This generic account is used by the PerformancePoint Service
application to access data sources where no specific credentials are
provided. The Unattended Service Account is configured via
Central Administration and can be found in the PerformancePoint Service
Application Settings section of the PerformancePoint Service Application
management page. This can be accessed by choosing Central
Administration | Manage Service Applications | PerformancePoint Service
Application | PerformancePoint Service Application Settings | Secure
Store And Unattended Service Account. To use the Unattended Service
Account, the Secure Store Service must also be properly configured.
Unattended Service Account and Add Authenticated User Name In Connection String
For some data sources, the username is useful for providing a
personalized view of the data. By selecting this option, the data source
is still accessed using the unattended service account credentials, but
the username of the requesting user is also passed to the data source
via the CustomData connection string property. CustomData is an Analysis
Services–specific connection string property and can contain any string
value. The value of the property can then be picked up within the OLAP
project by using the CustomData() Multidimensional Expressions (MDX) language function.
Per-user Identity
By selecting this option, the identity of the requesting user is used
to access the data source. This option offers a more granular approach
to security but does so at the expense of having to manage requesting
user access directly on the data source.
Now
that we have some understanding of the options available, we’ll use the
default value of Unattended Service Account. As mentioned earlier, in
order for this to work the account must be appropriately configured in
Central Administration.
Click
Test Data Source to confirm connectivity. Once connectivity has been
confirmed, click the Save icon to persist the changes.
Although we’ve used only one data connection for this
demonstration, you can use any number of data connections within a
PerformancePoint workspace. For example, if our application captured
data using a survey in SharePoint 2010, we could easily include the
results of the survey in our dashboard by creating a connection to the
appropriate SharePoint list. As you saw when creating our Analysis
Services connection, available options include Excel Services,
SharePoint lists, and SQL Server tables.